test1
Home Curriculum Vitae StudentOppotunities Student Oppotunities Monitoring Publications Contact

モニタリング(Monitoring)

  • このページではGNSS連続観測による近畿地方及びその周辺の最近の地殻変動データを紹介します.

This page shows data of crustal deformation in the Kinki district, central Japan, monitored by continous GNSS observations.

Topics)能登半島西部の観測点を追加しました。

swjapan2

図1 最近1年間(365日)の西日本の水平変動ベクトル.ユーラシアプレート固定.青い四角をクリックするとその地域の拡大図が表示されます

Figure 1 Horizontal displacement in southwest Japan for recent 1 year. Reference frame is the Eurasian plate.

cnjapan2

図2 最近1年間(365日)の中日本の水平変動ベクトル.ユーラシアプレート固定.青い四角をクリックするとその地域の拡大図が表示されます

Figure 2 Horizontal displacement in central Japan for recent 1 year. Reference frame is the Eurasian plate.

nejapan2

図3 最近1年間(365日)の北日本の水平変動ベクトル.北米プレート固定.

Figure 3 Horizontal displacement in north Japan for recent 1 year. Reference frame is the North American plate.

ryukyu2

図4 最近1年間(365日)の南西諸島の水平変動ベクトル.ユーラシアプレート固定.青い四角をクリックするとその地域の拡大図が表示されます

Figure 4 Horizontal displacement in southwesternmost Japan for recent 1 year. Reference frame is the Eurasian plate.

kansai2

図5 最近1年間(365日)の近畿地方の水平変動ベクトル.薄赤の破線は,地震調査研究推進本部による主要活断層の分布.青四角をクリックするとその観測点の最近2年分の時系列が表示されます.

Figure 5 Horizontal displacement in the Kinki district for recent 1 year. Light red broken lines indicate traces of major active faults investigated by the Headquarters for Earthquake Research Promotion. Clicking blue squares appear timeseries of daily coordinates.

kii2

図6 最近1年間(365日)の紀伊半島の水平変動ベクトル.薄赤の破線は,地震調査研究推進本部による主要活断層の分布.青四角をクリックするとその観測点の最近2年分の時系列が表示されます.

Figure 6 Horizontal displacement in the Kii Peninsula for recent 1 year. Light red broken lines indicate traces of major active faults investigated by the Headquarters for Earthquake Research Promotion. Clicking blue squares appear timeseries of daily coordinates.

kiicha2

図7 最近1年間(365日)の紀伊水道周辺の水平変動ベクトル.薄赤の破線は,地震調査研究推進本部による主要活断層の分布.青四角をクリックするとその観測点の最近2年分の時系列が表示されます.

Figure 7 Horizontal displacement around the Kii Channel for recent 1 year. Light red broken lines indicate traces of major active faults investigated by the Headquarters for Earthquake Research Promotion. Clicking blue squares appear timeseries of daily coordinates.

tottori2

図8 最近1年間(365日)の鳥取県及びその周辺の水平変動ベクトル.薄赤の破線は,地震調査研究推進本部による主要活断層の分布.青四角をクリックするとその観測点の最近2年分の時系列が表示されます.矢印のスケールが他と違うことに注意.

Figure 8 Horizontal displacement in and around Tottori Prefecture for recent 1 year. Light red broken lines indicate traces of major active faults investigated by the Headquarters for Earthquake Research Promotion. Clicking blue squares appear timeseries of daily coordinates.

bungo2

図9 最近1年間(365日)の豊後水道周辺の水平変動ベクトル.薄赤の破線は,地震調査研究推進本部による主要活断層の分布.青四角をクリックするとその観測点の最近2年分の時系列が表示されます.

Figure 9 Horizontal displacement in and around the Bungo Channel for recent 1 year. Light red broken lines indicate traces of major active faults investigated by the Headquarters for Earthquake Research Promotion.

skyushu2

図10 最近1年間(365日)の南九州の水平変動ベクトル.薄赤の破線は,地震調査研究推進本部による主要活断層の分布.矢印のスケールが他と違うことに注意.青四角をクリックするとその観測点の最近2年分の時系列が表示されます.

Figure 10 Horizontal displacement in southern Kyushu for recent 1 year. Light red broken lines indicate traces of major active faults investigated by the Headquarters for Earthquake Research Promotion.

chubu2

図11 最近1年間(365日)の中部地方の水平変動ベクトル.薄赤の破線は,地震調査研究推進本部による主要活断層の分布.青四角をクリックするとその観測点の最近2年分の時系列が表示されます.

Figure 11 Horizontal displacement in the Chubu district for recent 1 year. Light red broken lines indicate traces of major active faults investigated by the Headquarters for Earthquake Research Promotion.

niigata2

図12 最近1年間(365日)の新潟地方の水平変動ベクトル.薄赤の破線は,地震調査研究推進本部による主要活断層の分布.青四角をクリックするとその観測点の最近2年分の時系列が表示されます.

Figure 12 Horizontal displacement in the Niigata district for recent 1 year. Light red broken lines indicate traces of major active faults investigated by the Headquarters for Earthquake Research Promotion.

noto2

図13 最近1年間(365日)の能登(石川県)地方の水平変動ベクトル.薄赤の破線は,地震調査研究推進本部による主要活断層の分布.青四角をクリックするとその観測点の最近2年分の時系列が表示されます.矢印のスケールが他と違うことに注意.

Figure 13 Horizontal displacement in the Noto (Ishikawa) district for recent 1 year. Light red broken lines indicate traces of major active faults investigated by the Headquarters for Earthquake Research Promotion.

tokai2

図14 最近1年間(365日)の東海(静岡)地方の水平変動ベクトル.薄赤の破線は,地震調査研究推進本部による主要活断層の分布.青四角をクリックするとその観測点の最近2年分の時系列が表示されます.

Figure 14 Horizontal displacement in the Tokai (Shizuoka) district for recent 1 year. Light red broken lines indicate traces of major active faults investigated by the Headquarters for Earthquake Research Promotion.

okinawa2

図15 最近1年間(365日)の沖縄本島地方の水平変動ベクトル.薄赤の破線は,地震調査研究推進本部による主要活断層の分布.青四角をクリックするとその観測点の最近2年分の時系列が表示されます.

Figure 15 Horizontal displacement in the Okinawa district for recent 1 year. Light red broken lines indicate traces of major active faults investigated by the Headquarters for Earthquake Research Promotion.

yaeyama2

図16 最近1年間(365日)の八重山(沖縄)地方の水平変動ベクトル.薄赤の破線は,地震調査研究推進本部による主要活断層の分布.青四角をクリックするとその観測点の最近2年分の時系列が表示されます.

Figure 16 Horizontal displacement in the Yaeyama (west Okinawa) district for recent 1 year. Light red broken lines indicate traces of major active faults investigated by the Headquarters for Earthquake Research Promotion.

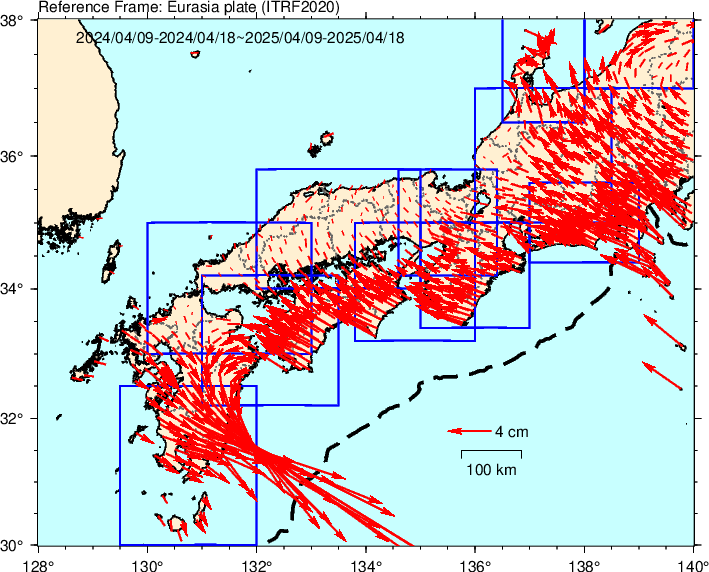
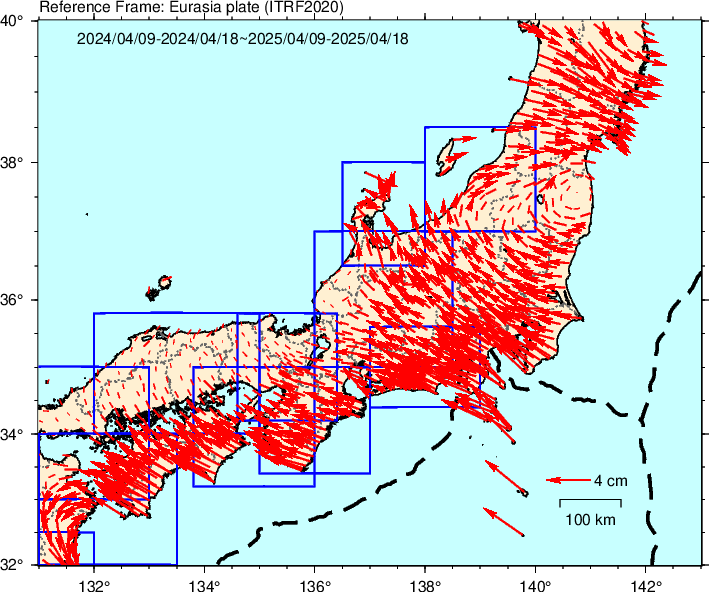
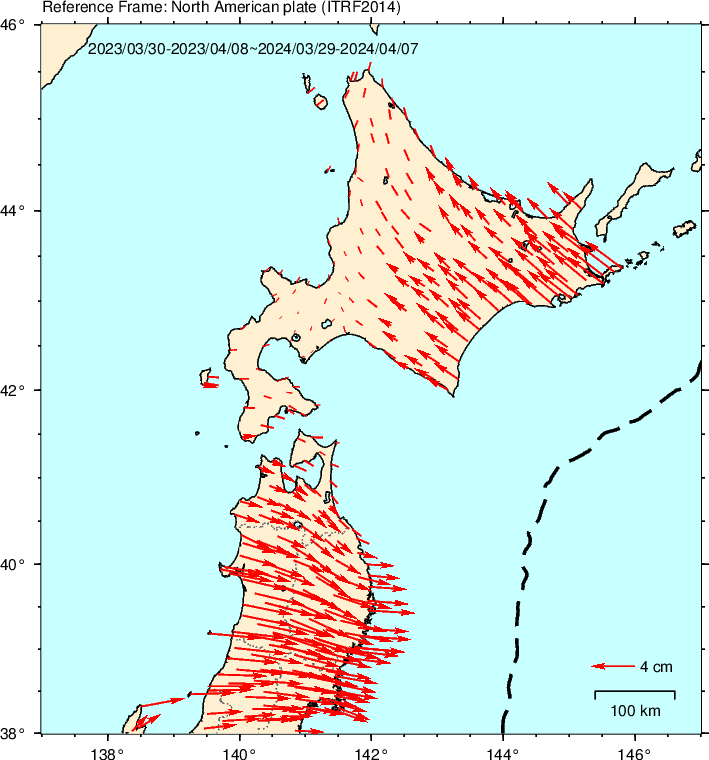
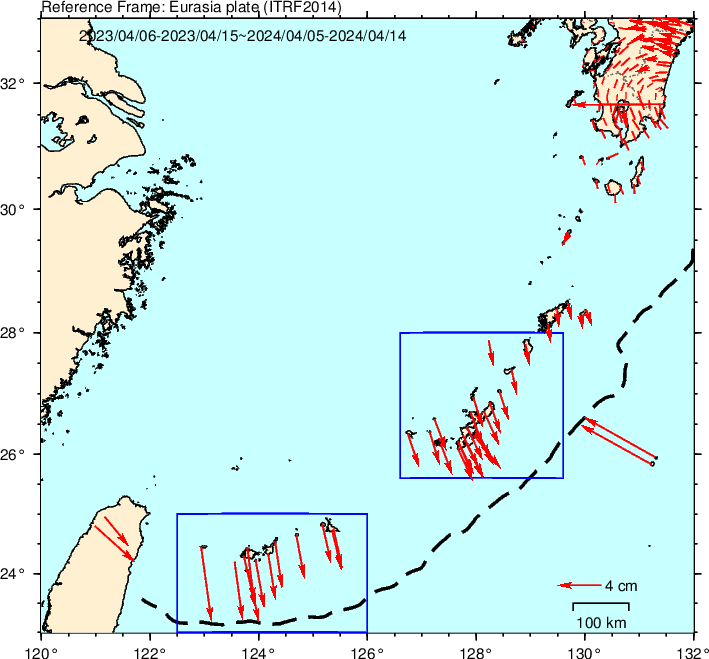
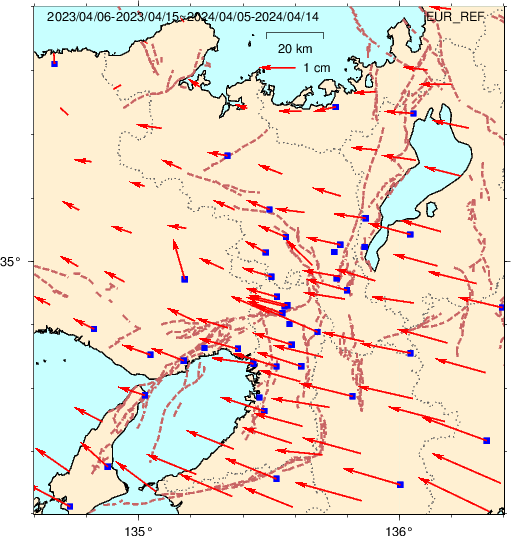
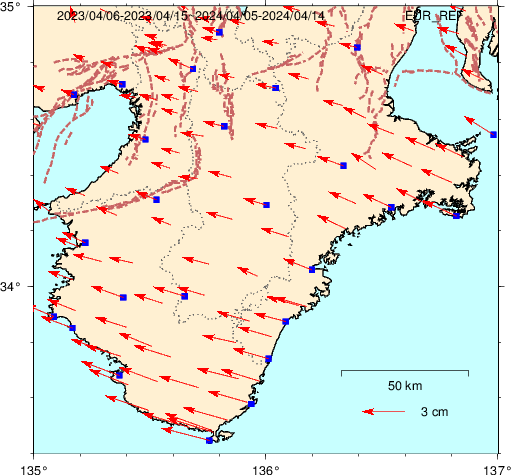
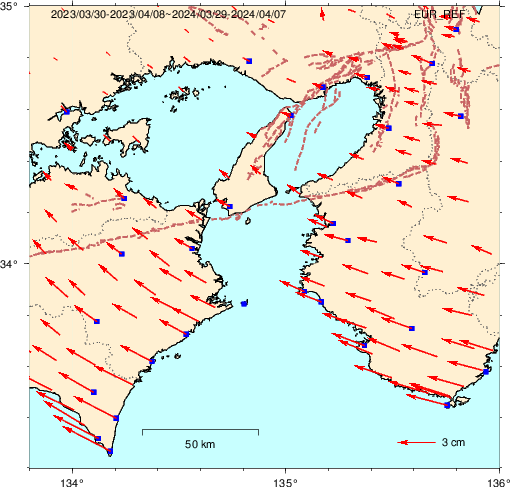
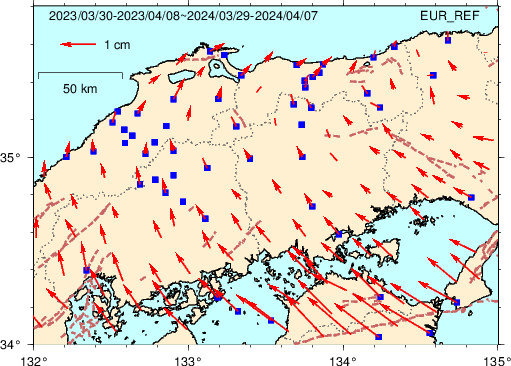
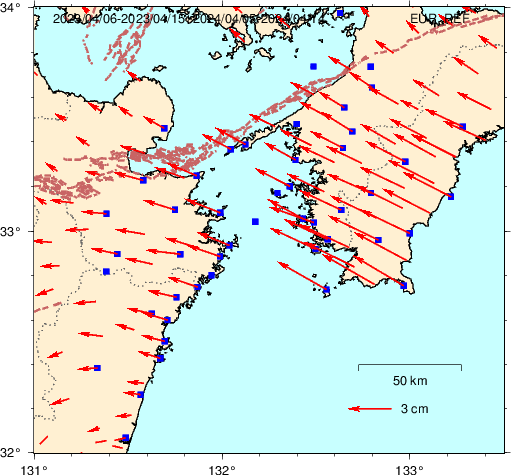
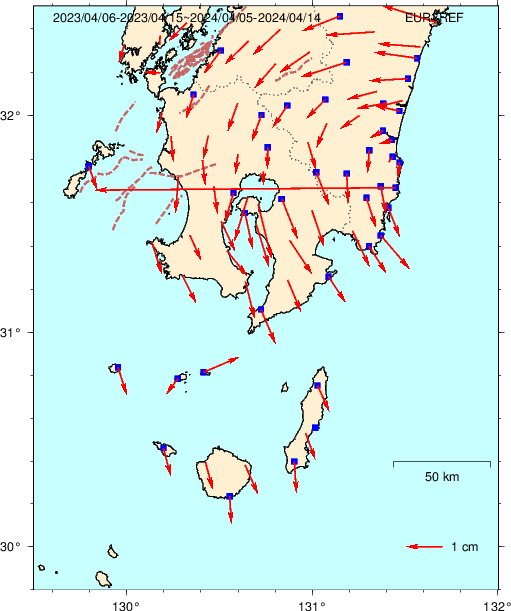
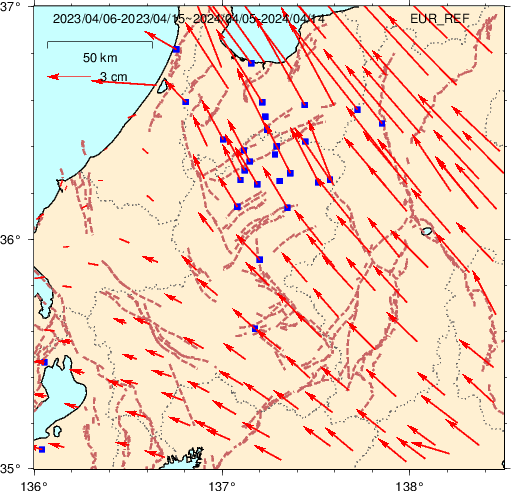
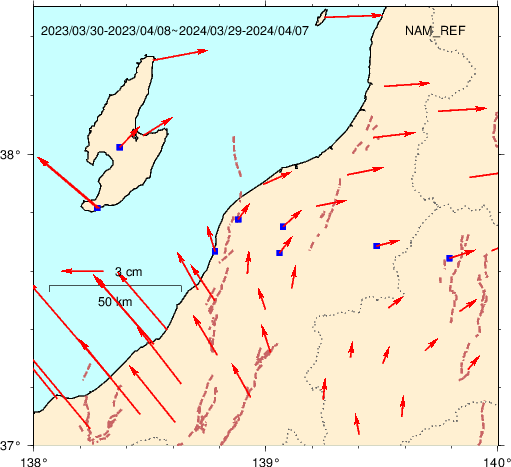
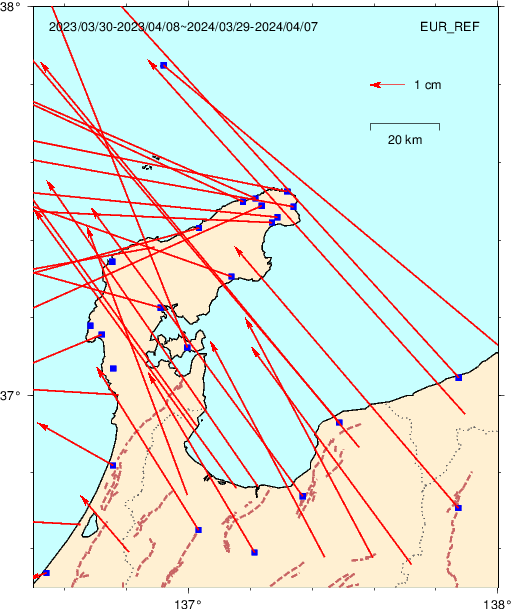
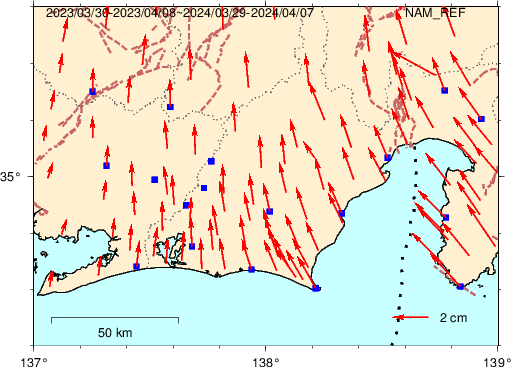
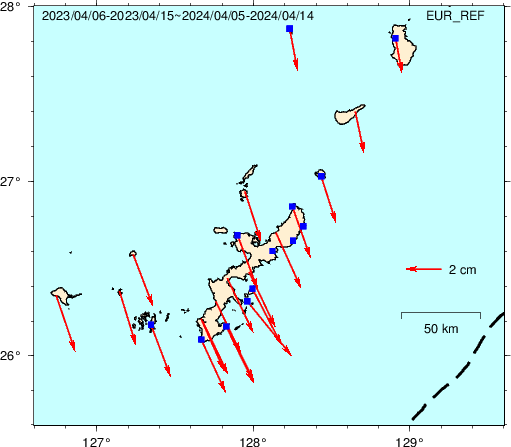
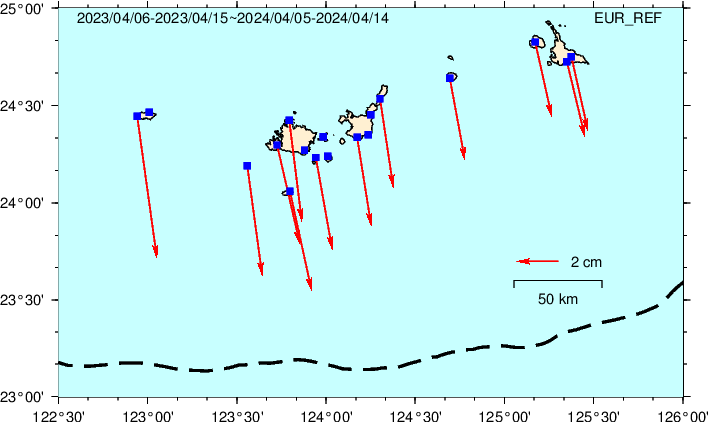
Above figures are results of daily coordinates estimated using GIPSY 6.4 software with the PPP+AR strategy and RINEX data for GNSS stations of DPRI of Kyoto Univ., Nagoya Univ., Kyushu Univ., Kochi Univ., Goespatial Information Authority of Japan, Japan Coast Guard,Kyoto City Archaeological Research Institute, Geo-Research Institute, Korean GNSS Integrated Data Center and IGS (International GNSS Service). The figures are to be updated every Saturday, using data aqcruired about two weeks ago.

Acknowledgement: We used data of GEONET (Geosptial Information Authority of Japan; GSI), DGPS (Japan Coast Guard; JCG), and private control points (Kyushu Electoric Company) for plotting figures. We thank GSI and JCG for maitaining these valuable networks. GNSS sites operated by the univesities are funded by the Grant-in-Aid for Scientific Research, Kyoto University DPRI Collborative Research, the MEXT Earthquake and Volcano Hazards Observation and Research Program. We also thank Mr. Kengo Miyahara for providing GNSS data.

このページは,京都大学防災研究所,名古屋大学,九州大学,高知大学,神戸大学,国土地理院,海上保安庁,韓国GNSS統合データセンター及びIGS(国際GNSSサービス),京都市埋蔵文化財研究所,(一財)地域地盤環境研究所のGNSS観測点のデータを示したものです.データ解析には,GipsyX 1.3(PPP+AR)ソフトウェアを用い,日座標値を算出しています.最新のプロットは,約2週間前のデータを用いて作成しています.本ページは毎週日曜日午前11時頃に更新する予定です.

謝辞 本ページの図には,国土地理院GEONET,海上保安庁DGPS,民間電子基準点(九州電力)のデータを使用しています.日頃から観測網を維持管理して頂いている両機関に感謝いたします.また,大学が設置した観測点は,科学研究費補助金,京都大学防災研究所共同利用などの経費で設置され,文部科学省による「災害の軽減に貢献するための地震火山観測研究計画」などの経費で保守を行っています.京都市埋蔵文化財研究所宮原健吾様にはGNSSデータの提供に際して大変お世話になりました.ここに記して感謝いたします.

logov3 wwwrcepdprikyotouacjp
item372 item339 item338 item337 item222 item171 item148 item147 item70 item69 item68 item244 item371 item336 item335 item261 item260 item259 item258 item257 item256 item255 item242 item305 item243